 Real-IQ
Official IQ Testing & WAIS Bell Curve: What Your Score Really Means
Understand the WAIS IQ bell curve, percentiles, standard deviation, and measurement error. Learn why a single IQ score hides your true cognitive strengths.
You open your test report and you see a three-digit number right on your screen.
You might see a 118, or you might see a 132 looking back at you.
Most people treat that number as a permanent biological label that they have to live with.
They think it is just like their adult height or their own blood type.
That whole assumption is completely wrong from the ground up.
An IQ score does not measure the total size or the physical volume of your brain power.
It simply ranks how well you did against thousands of other people who took the very same test on that day.
When you learn how psychologists build the Gaussian bell curve, all the mystery goes away.
You can look at what your brain does best and you can build on your real strengths.
How the Gaussian Bell Curve Works
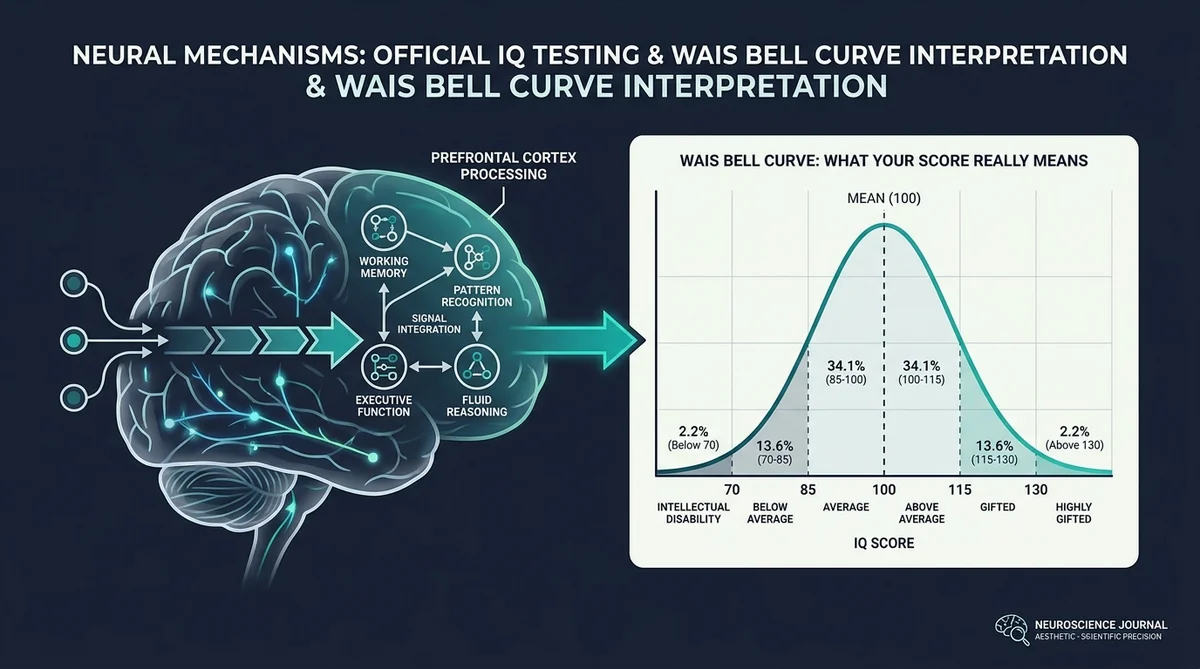
Modern testing relies on what mathematicians call a normal distribution to standardize scores for all of us.
This mathematical model creates the bell-shaped curve that you see in science books.
The middle of the curve is always set right at 100 points.
The standard deviation, which we write as σ, is set to 15 points on the modern Wechsler scale.
When we look at human cognitive traits across large groups of people, they follow this smooth curve very closely.
About 68.2 percent of all adults score somewhere between 85 and 115 points.
This broad middle band is what we call the average range, and that is where most people land.
As you move further out along the curve, 95.4 percent of the population falls between 70 and 130 points.
Only about 2.2 percent of people reach a score that sits above 130.
That upper threshold is what you need to qualify for high-IQ societies like Mensa.
At the other end, the same slice of 2.2 percent lands below 70 points on clinical evaluations.
Percentiles vs Raw IQ Scores: What the Bands Mean
A raw score of how many questions you got right on a test tells you very little on its own.
Psychologists turn your raw score into a percentile rank to give the number a clear and practical meaning for you.
Your percentile tells you what share of the group scored below you on that specific test.
| IQ Score Band | Standard Deviation (σ) | Population Percentile | WAIS-IV Classification | Real-World Cognitive Profile |
|---|---|---|---|---|
| 130 and Above | +2.0σ and above | Top 2.2% (98th+) | Very Superior | Rapid abstract synthesis, solves novel logic with high speed |
| 120 – 129 | +1.33σ to +1.99σ | Top 9% to 2% (91st–97th) | Superior | Strong analytical deduction, grasps complex systemic models easily |
| 110 – 119 | +0.67σ to +1.32σ | 75th to 90th percentile | High Average | Quick learner, handles advanced technical workflows efficiently |
| 90 – 109 | -0.67σ to +0.66σ | 25th to 74th percentile | Average | Solid everyday reasoning, benefits from structured step-by-step training |
| 80 – 89 | -1.33σ to -0.68σ | 9th to 24th percentile | Low Average | Slower processing speed, requires repetition for procedural tasks |
| 70 – 79 | -1.99σ to -1.34σ | 2nd to 8th percentile | Borderline | Notable struggle with abstract reasoning and working memory demands |
You can see how percentiles bunch up tight in the middle and spread out far at the ends.
When you move up from 100 to 110, you jump ahead by twenty-five full percentile points.
When you move up from 130 to 140, you gain less than two percentile points in the rankings.
Small score changes out on the edge represent huge leaps in how rare that score is.
What a Composite IQ Number Conceals
Standard intelligence tests like the WAIS-IV bundle a whole set of different subtests into one general score.
This Full Scale IQ takes the average of four distinct cognitive pillars: * Verbal Comprehension Index (VCI) * Perceptual Reasoning Index (PRI) * Working Memory Index (WMI) * Processing Speed Index (PSI)
Averaging all of these separate skills into one flat number creates a real problem.
Two people can receive the exact same score of 120 and have completely different minds.
The first person might have an outstanding working memory score of 135 and a modest cognitive processing speed score of 105.
The second person might show the exact opposite pattern in their results.
The single headline score says that both of them are the same.
In real life, they run into completely different bottlenecks when they try to get work done.
That is why you get so much more value when you look at your five distinct cognitive domains instead of one flat number.
Neural Hardware: The P-FIT Model of Intelligence
Your intellectual capacity is not some abstract idea. It rests directly on physical brain structures and neural circuits in your head.
In 2007, neuroscientists Rex Jung and Richard Haier published the Parieto-Frontal Integration Theory, which we call P-FIT.
This model shows how information travels through a connected network of cortical regions in your brain.
Sensory data enters your brain through your visual and auditory cortices.
Your parietal cortex organizes all of those visual symbols, shapes, and spatial maps.
Signals then move along white matter pathways straight into your dorsolateral prefrontal cortex.
Your prefrontal cortex weighs your choices, tests hypotheses, and picks logical solutions for you.
People with higher test scores show stronger white matter tract integrity in their brain scans.
Their axons have thicker myelin sheaths, so electrical signals travel along them with less delay.
They also show higher neural efficiency, burning less glucose in their brain tissue when they solve hard problems.
Measurement Error and the Flynn Effect
Every test in the world has some natural statistical wiggle room in its scores.
Psychologists call this variation the Standard Error of Measurement, or SEM for short.
On most validated clinical exams, the SEM is between three and five points on any given day.
If you score a 120, your true ability sits inside a 95 percent confidence band that runs from 114 to 126.
If you take the test on another morning, your score can easily shift by several points.
How well you slept, how stressed you feel, and how much coffee you drank all add noise to your result.
At the same time, average test scores across the whole population slowly drift upward over the decades.
In 1984, researcher James Flynn proved that raw scores on fluid tests rose by about three points per decade during the twentieth century.
Scientists now call this trend the Flynn Effect.
Because of this generational rise, test publishers have to reset their baseline norms every ten to fifteen years.
A score of 100 today means you solved harder matrix puzzles than a score of 100 did back in 1960.
3 Protocols to Interpret and Optimize Your Cognitive Score
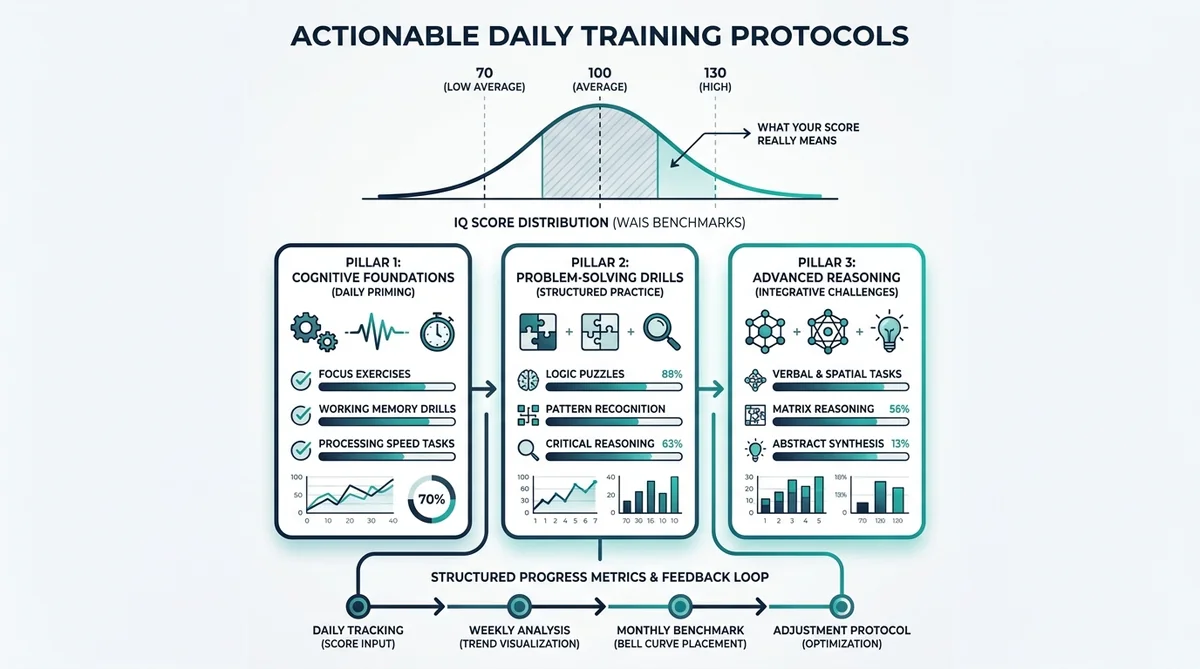
You can use these three practical protocols to evaluate and optimize your test scores.
Protocol 1: Calculate Your 95% Confidence Interval
You should never treat a single test score as if it were carved in stone.
You can calculate your realistic confidence band by using the standard error of measurement.
- Find the standard error: Look for the test SEM, which is usually four points on standard online matrix tests.
- Double the margin: Multiply the SEM by two so that you build a 95 percent confidence window.
- Write down your range: If you score a 116, note that your true score falls between 108 and 124.
- Follow the median: Take the median of three tests taken across several months instead of trusting one single run.
Protocol 2: Dissect Subtest Scatter and Domain Asymmetries
You can look behind your composite score to find where your real strengths and bottlenecks live.
- Check all five areas: Review your individual scores for working memory, spatial reasoning, speed, logic, and verbal fluency.
- Look for big gaps: A gap of fifteen points or more between two areas shows a clear cognitive asymmetry in your profile.
- Train the bottleneck: If your logic score is 125 but your speed sits at 95, train your visual scanning speed with daily drills.
- Rely on your strengths: Use your top area to back up your slower skills during complex projects at work.
Protocol 3: Eliminate Pre-Test Physiological Noise
You can prime your brain before you take an official matrix IQ test so that you avoid artificial score drops.
- Get seven hours of sleep: Sleep for at least seven hours to restore energy in your prefrontal cortex.
- Time your caffeine: Take a moderate 100 milligram dose of caffeine forty-five minutes before your test to sharpen your focus.
- Calm your nerves: Take two minutes of slow, deep breaths right before the timer starts to steady your heart rate.
- Warm up your focus: Do three quick mental math drills to wake up your working memory before the test begins.
Discover Your Complete Cognitive Profile
A single composite number only gives you a rough snapshot of one testing session on one day.
Your real cognitive power comes from how your different mental skills work together in your everyday life.
When you know your full profile, you can train your weak spots and make the most of what you do best.
You can test all five core cognitive domains right now.
Get your free 5-area cognitive profile on Real-IQ.
You will see an interactive radar chart with your strengths, your bottlenecks, and daily training recommendations.
Keep reading
Educational and entertainment content. Nothing here is medical, psychological or employment advice, and no online test is a clinical assessment.